PRODUCT INTRODUCTION
Measures the size and zeta potential of sub-micron particles
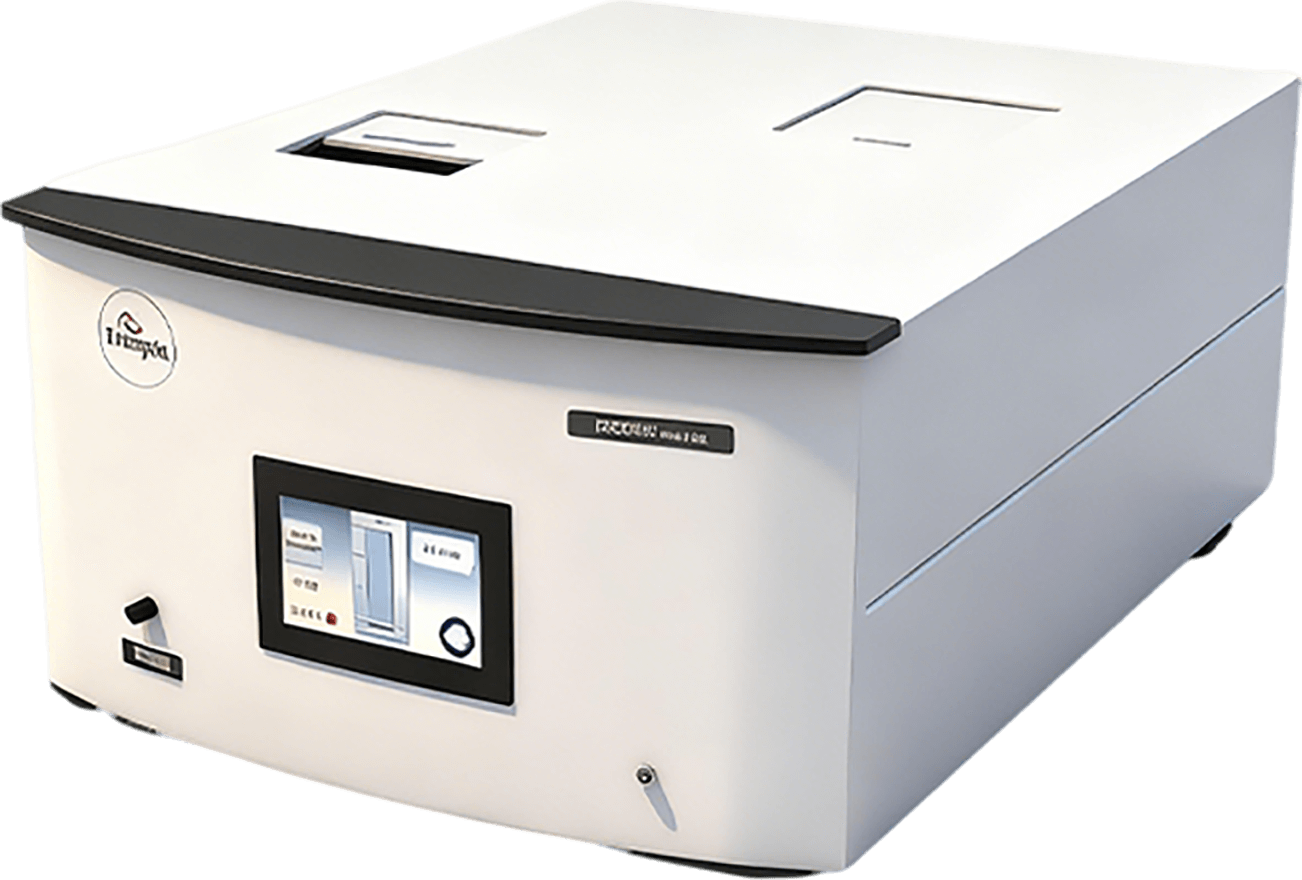
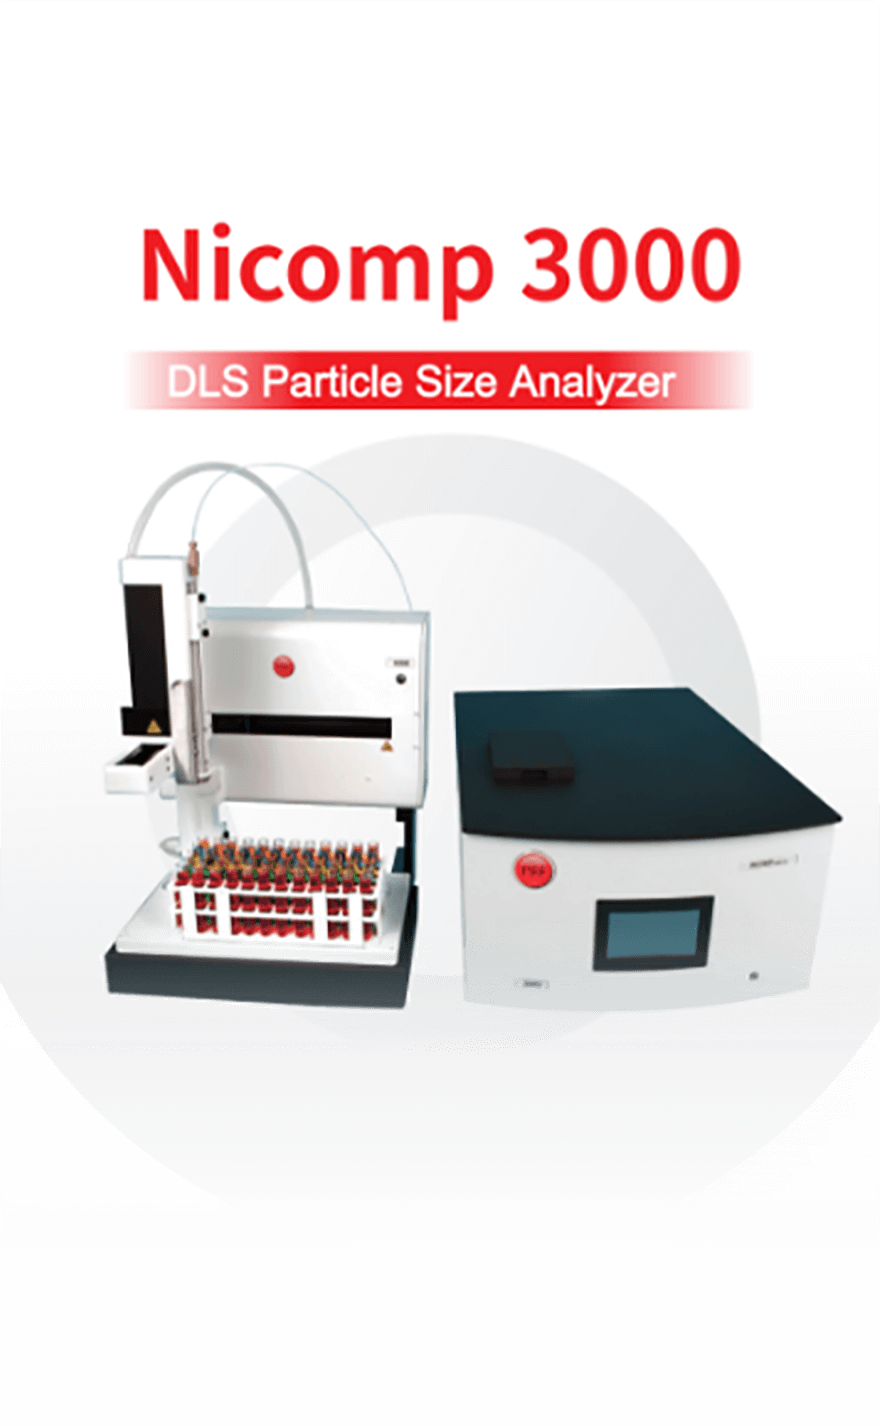
Nicomp Nano Z3000 System

Nicomp Z3000 Dynamic Light Scattering Particle Size Analyzer
Combines Dynamic Light Scattering (DLS) sizing capability with both frequency and Phase Analysis Light Scattering (PALS) modes for measuring zeta potential
With an elect electric field that can be varied from 1 to 250 Volts/cm, one instrument can be used to analyze zeta potential in aqueous and organic solvents
Cost of ownership is minimized with easy-to-use dip cell and inexpensive ZRS zeta potential standard
Principle
Measurement Range
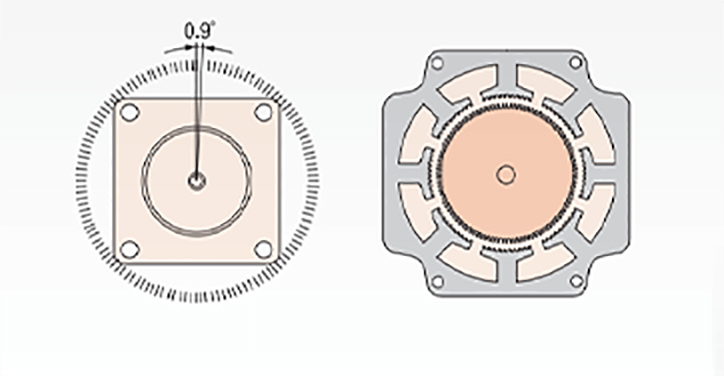
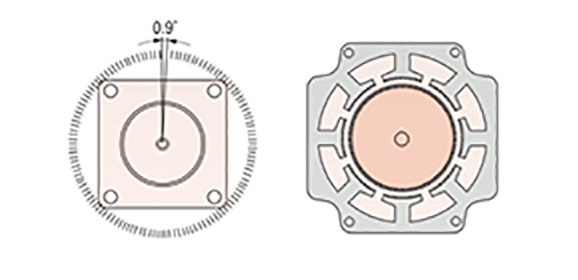
0.9° Stepwise Multi-Angle (MADLS) Module
- Covers 14.4°–180° detection range with 0.9° increments.
- Provides true multi-angle measurement, unlike traditional single-angle DLS.
- Enables optimized detection for ultra-small particles.
- Significantly improves resolution for complex systems
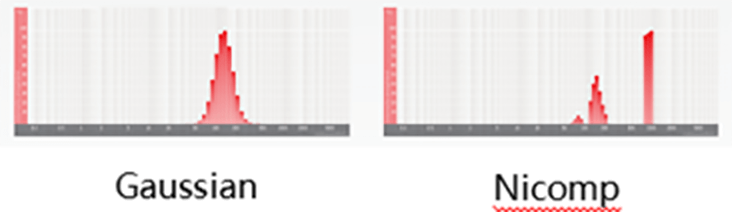
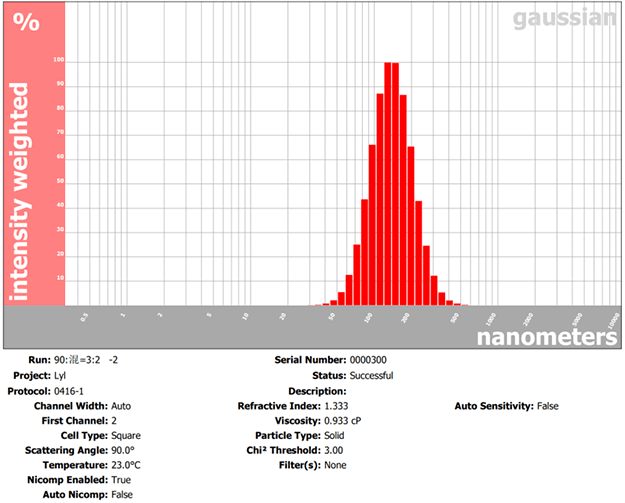
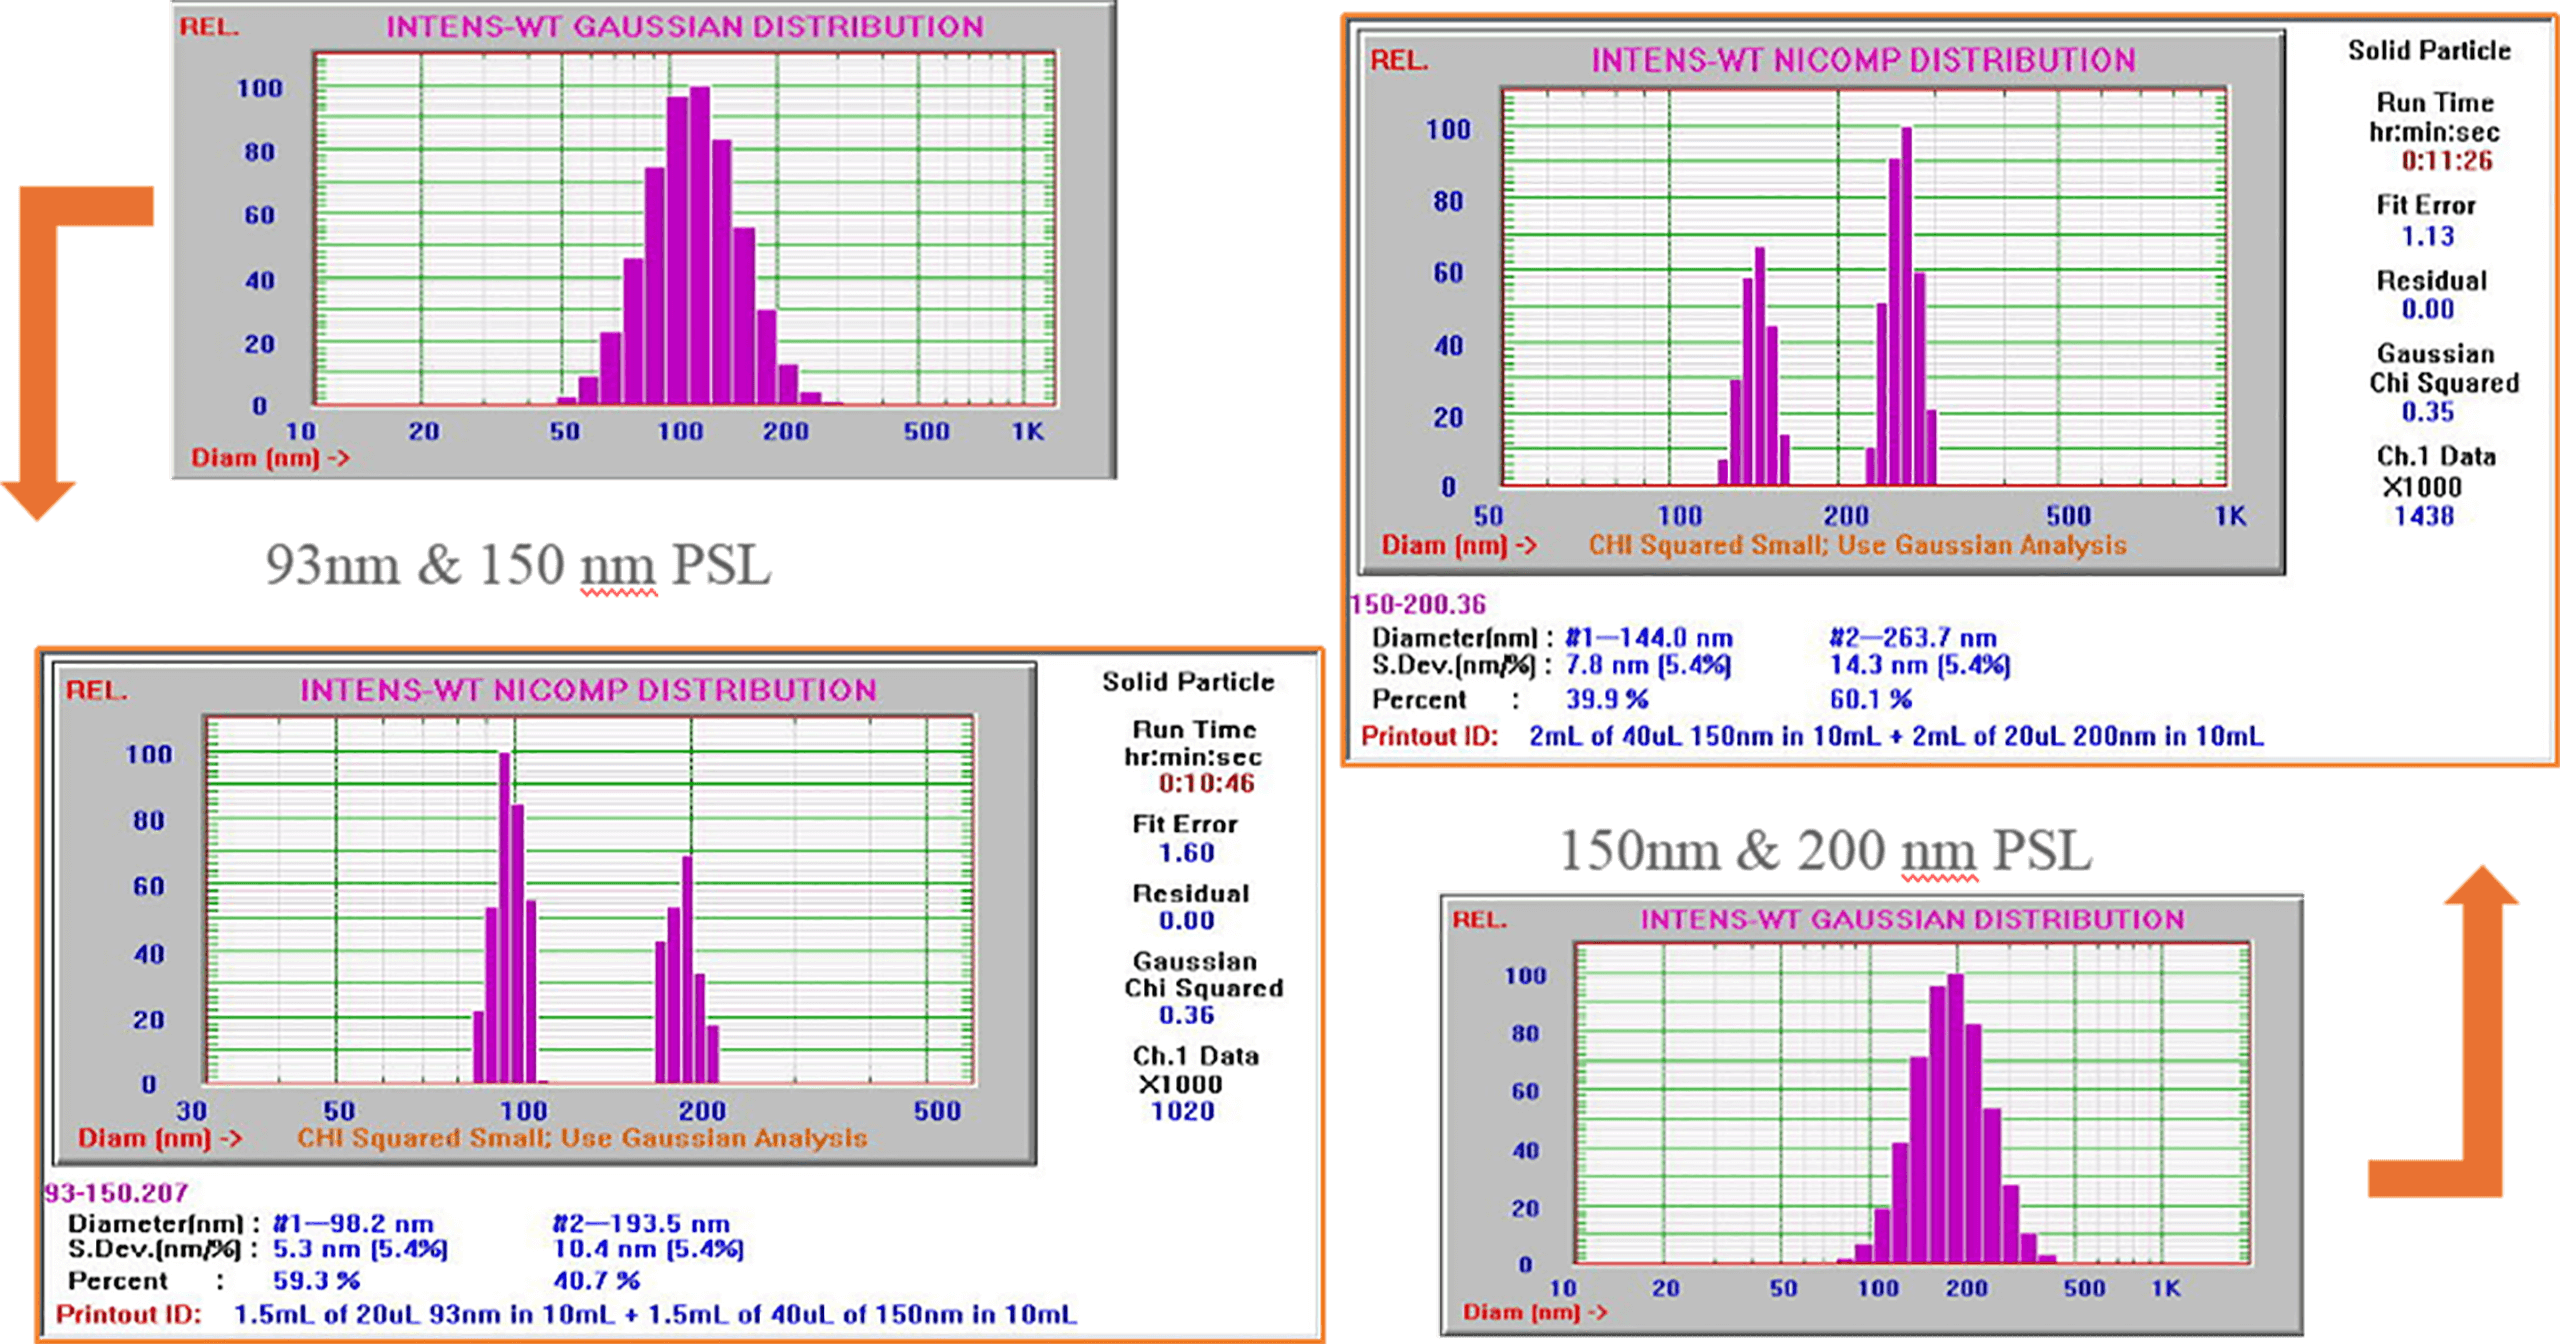
Proprietary Nicomp® Multi-Modal Algorithm
- Resolves multi-modal particle distributions.
- Can distinguish size ratios as close as 1:2 (unresolvable with Gaussian analysis).
- Delivers greater accuracy for complex and multi-component samples.
- (Below: Comparison of Gaussian analysis vs. Nicomp algorithm on the same complex sample.)
Over 50 Years of Legacy
Specializing in High-Precision Particle Characterization Solutions for Complex Systems
Empowering Your Exploration of the Nanoscale Universe with Unparalleled Precision!
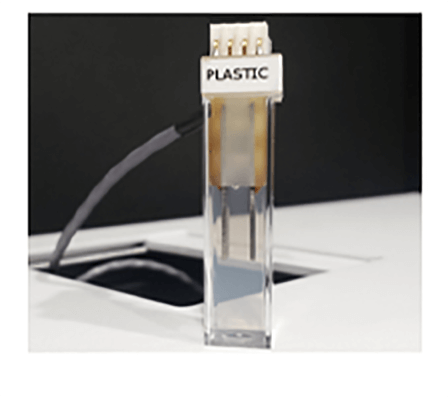
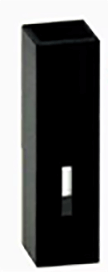
Reusable Plug-In Zeta Electrodes
- Uses dual-blade, plug-in style electrodes.
- Easy to clean and reuse, minimizing maintenance efforts.
- Reduces consumable costs compared to disposable electrodes.
- Environmentally friendly by lowering electrode waste.
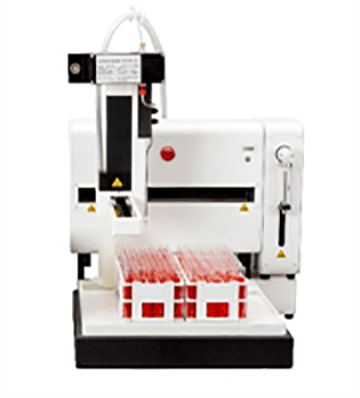
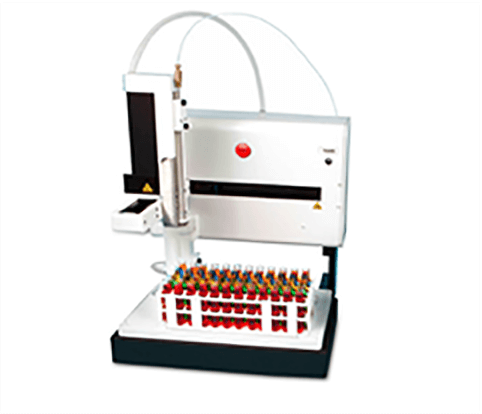
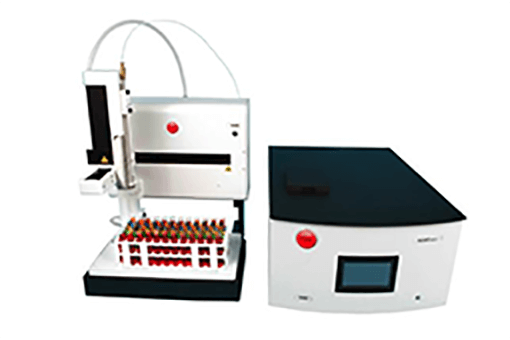
Automated Dilution and Auto-Sampler Modules
- First in DLS to integrate automated dilution and sample loading
- Eliminates manual preparation errors and human variability.
- Enables fully automated, high-throughput batch testing.
- Reduces labor costs and trial-and-error expenses.
PRINCIPLE
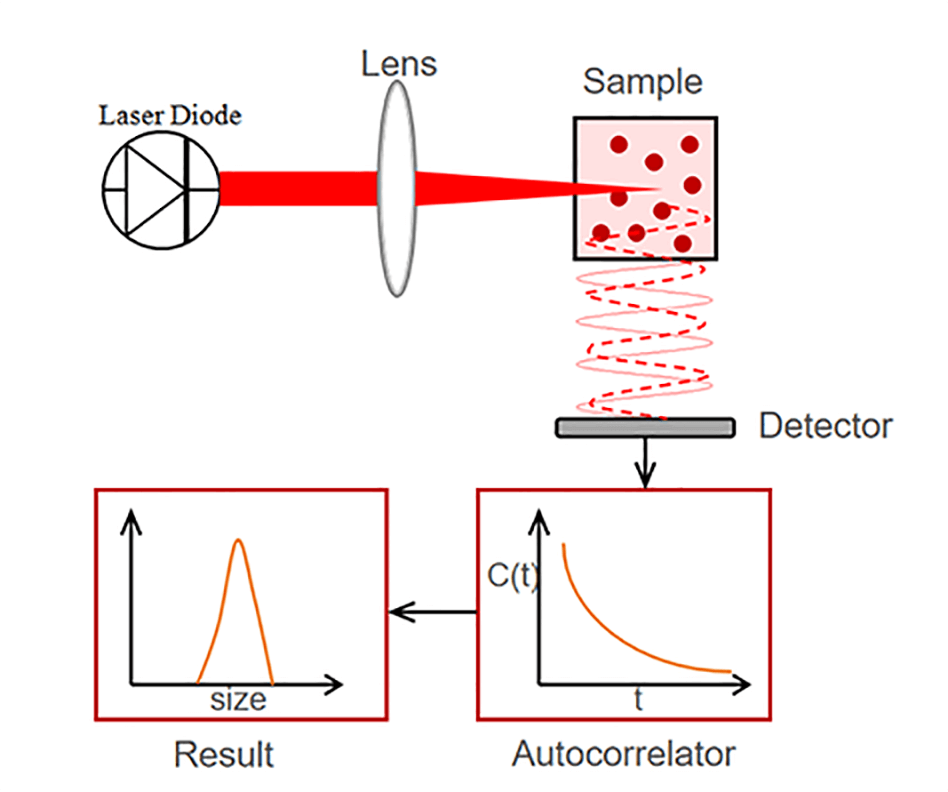
Principle - Dynamic light scattering (DLS)
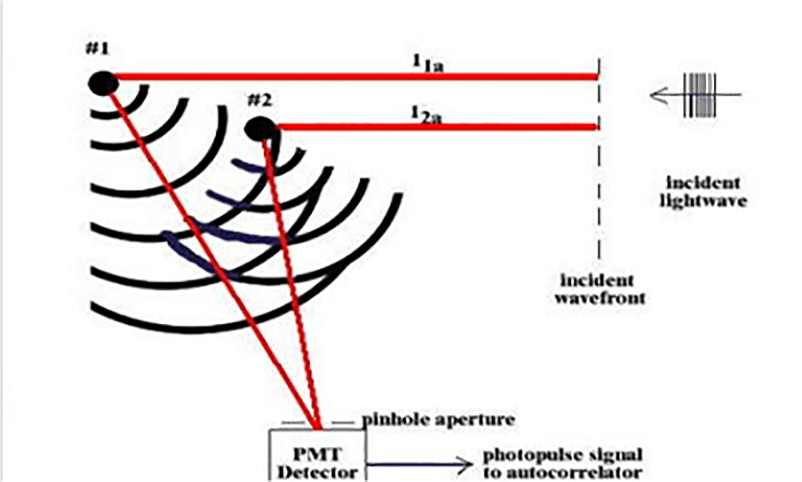
Light waves scattered by the particles combine at the detector coherently, to produce a net intensity signal
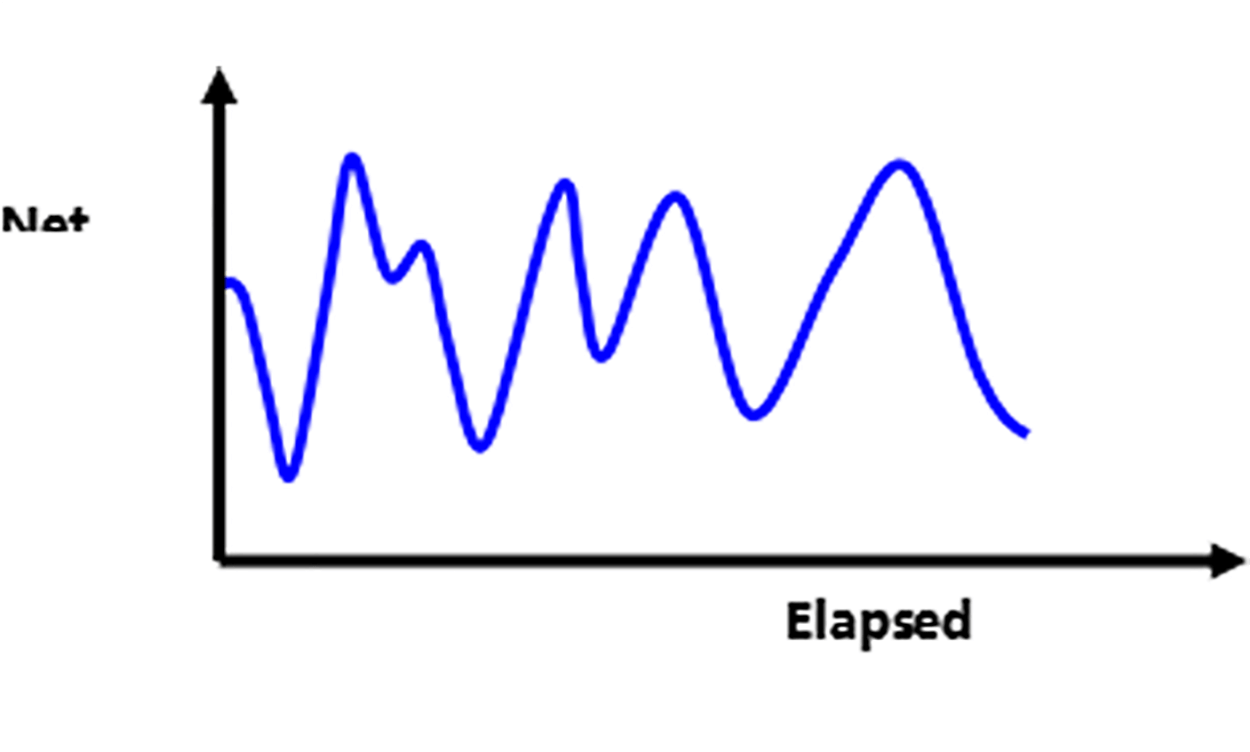
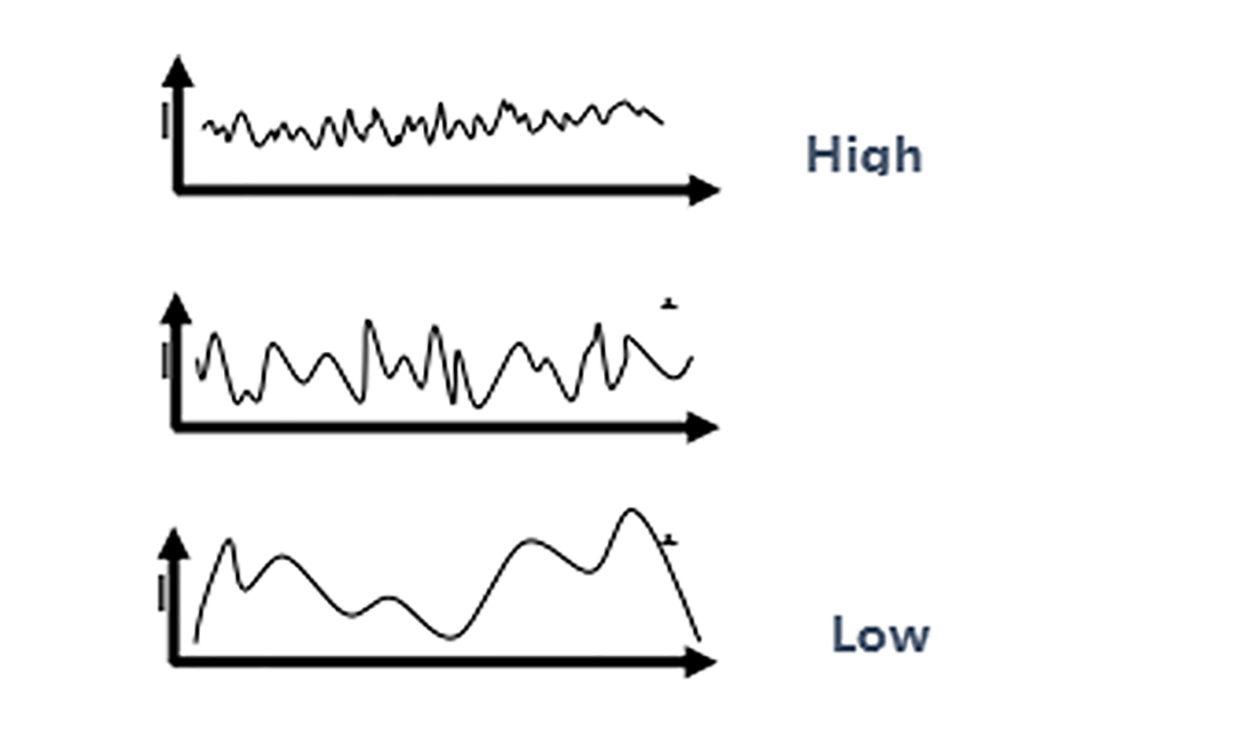
The net intensity fluctuates in time, due to the changing positions of the particles as they diffuse. The smaller the particles, the faster the diffusion and fluctuations.
Intensity vs. Time for Small, Medium & Large Particles
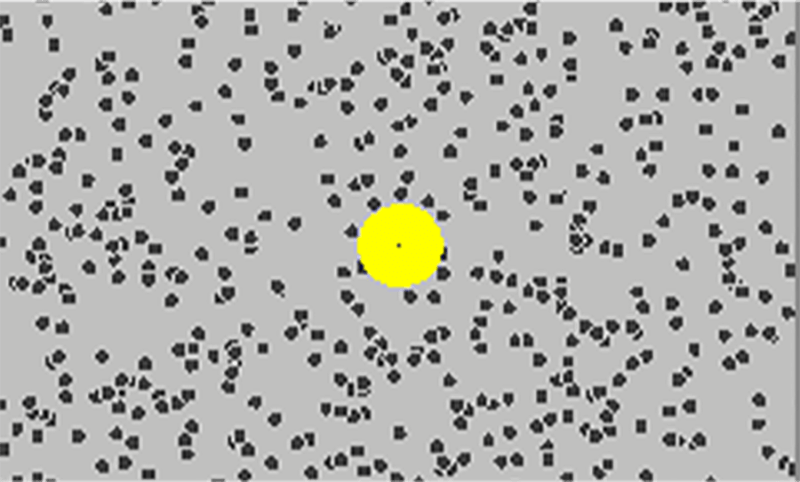
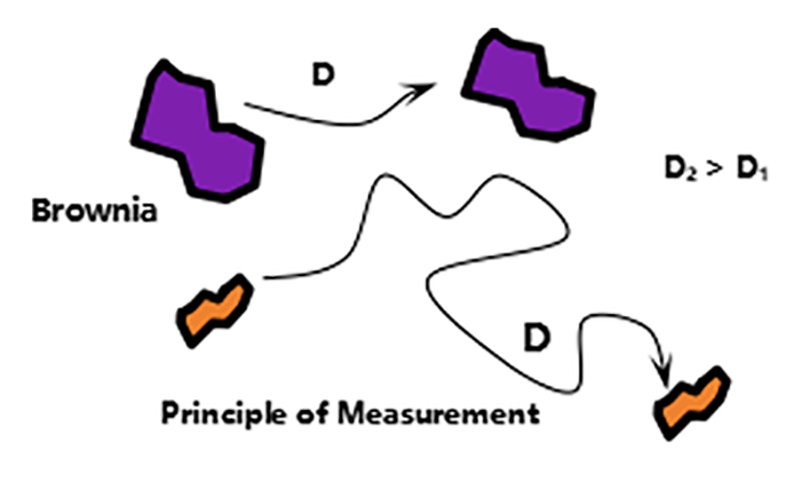
Principle - Dynamic light scattering (DLS)
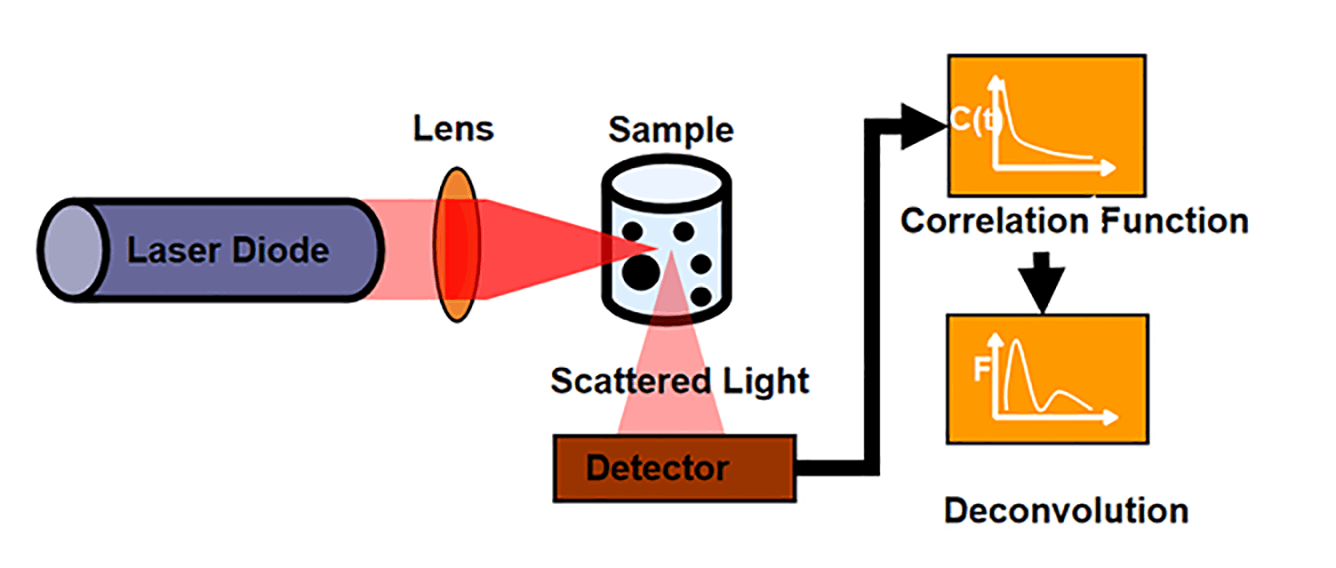
The sample is placed in a cuvette where the particles experience Brownian motion. Smaller particles move faster than larger particles. The cuvette is placed in the instrument where it is illuminated by a laser. The scattered light due to the Brownian motion is captured on a detector at a specific angle. The time signature of the scattered light is used to create an autocorrelation function that decays more rapidly for smaller particles and more slowly for larger particles. The translational diffusion coefficient(D) is determined from the autocorrelation function. The Einstein-Stokes equation is then used to calculate the particle radius R.
Einstein-Stokes equation
The Einstein-Stokes equation relates the diffusion rate of particles in a fluid to their size and is a foundational equation in Dynamic Light Scattering (DLS).
- D= Diffusion coefficient
- k = Boltzman's Constant
- T = Temperature Kelvin
- h= Shear Viscosity of the Solvent
- R= radius of the particles
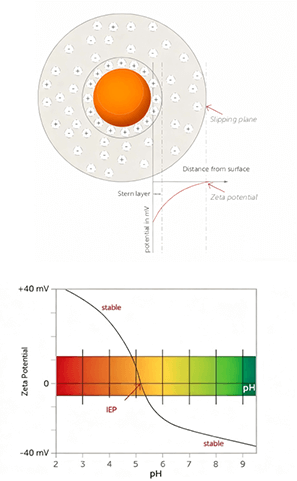
Principle -Zeta Potential
Zeta potential is a measure of the charge on the surface of particles or emulsion droplets. This charg is an indication of dispersion stability. Dispersions with a zeta potential near zero are typically unstable and prone to aggregation or phase separation. A higher zeta potential indicates expected greater stability.
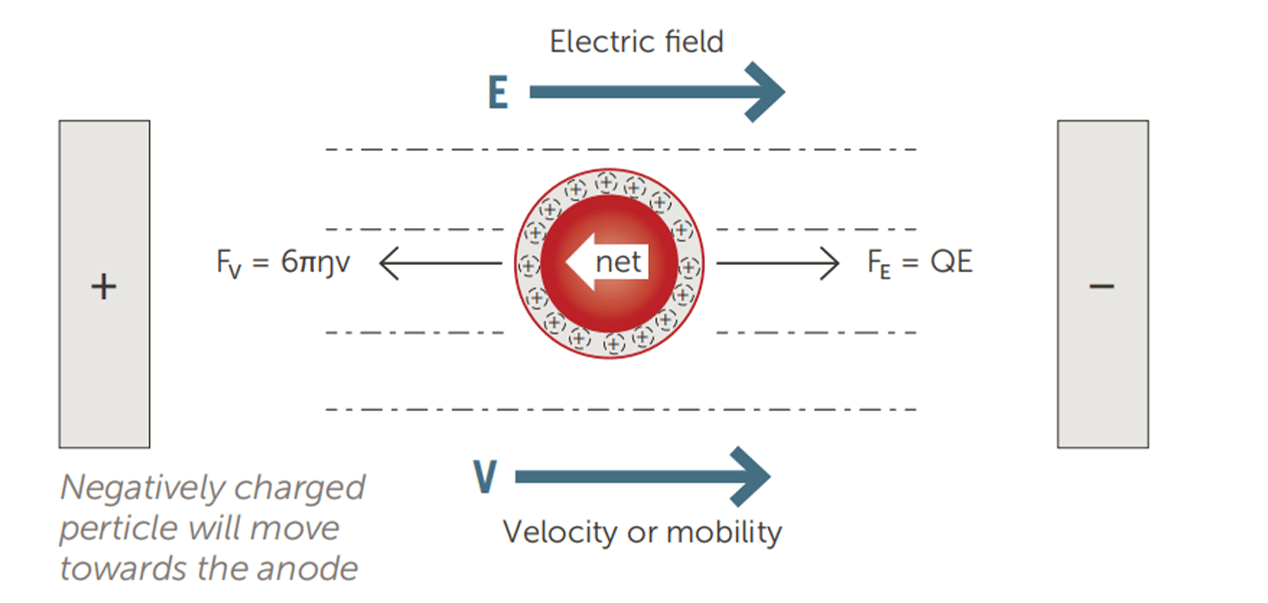
Direction indicates charge + or – and speed gives us mobility (magnitude of charge)
Zeta potential affects
zeta is a measure ofthe surface chemistry
(eg thetype of coating on the particle)
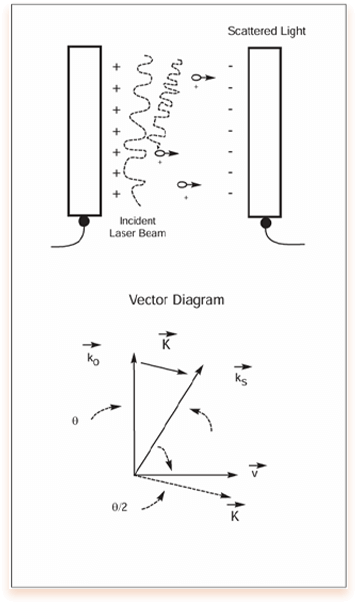
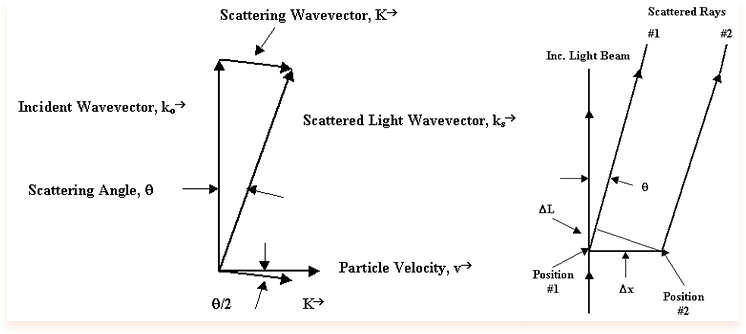
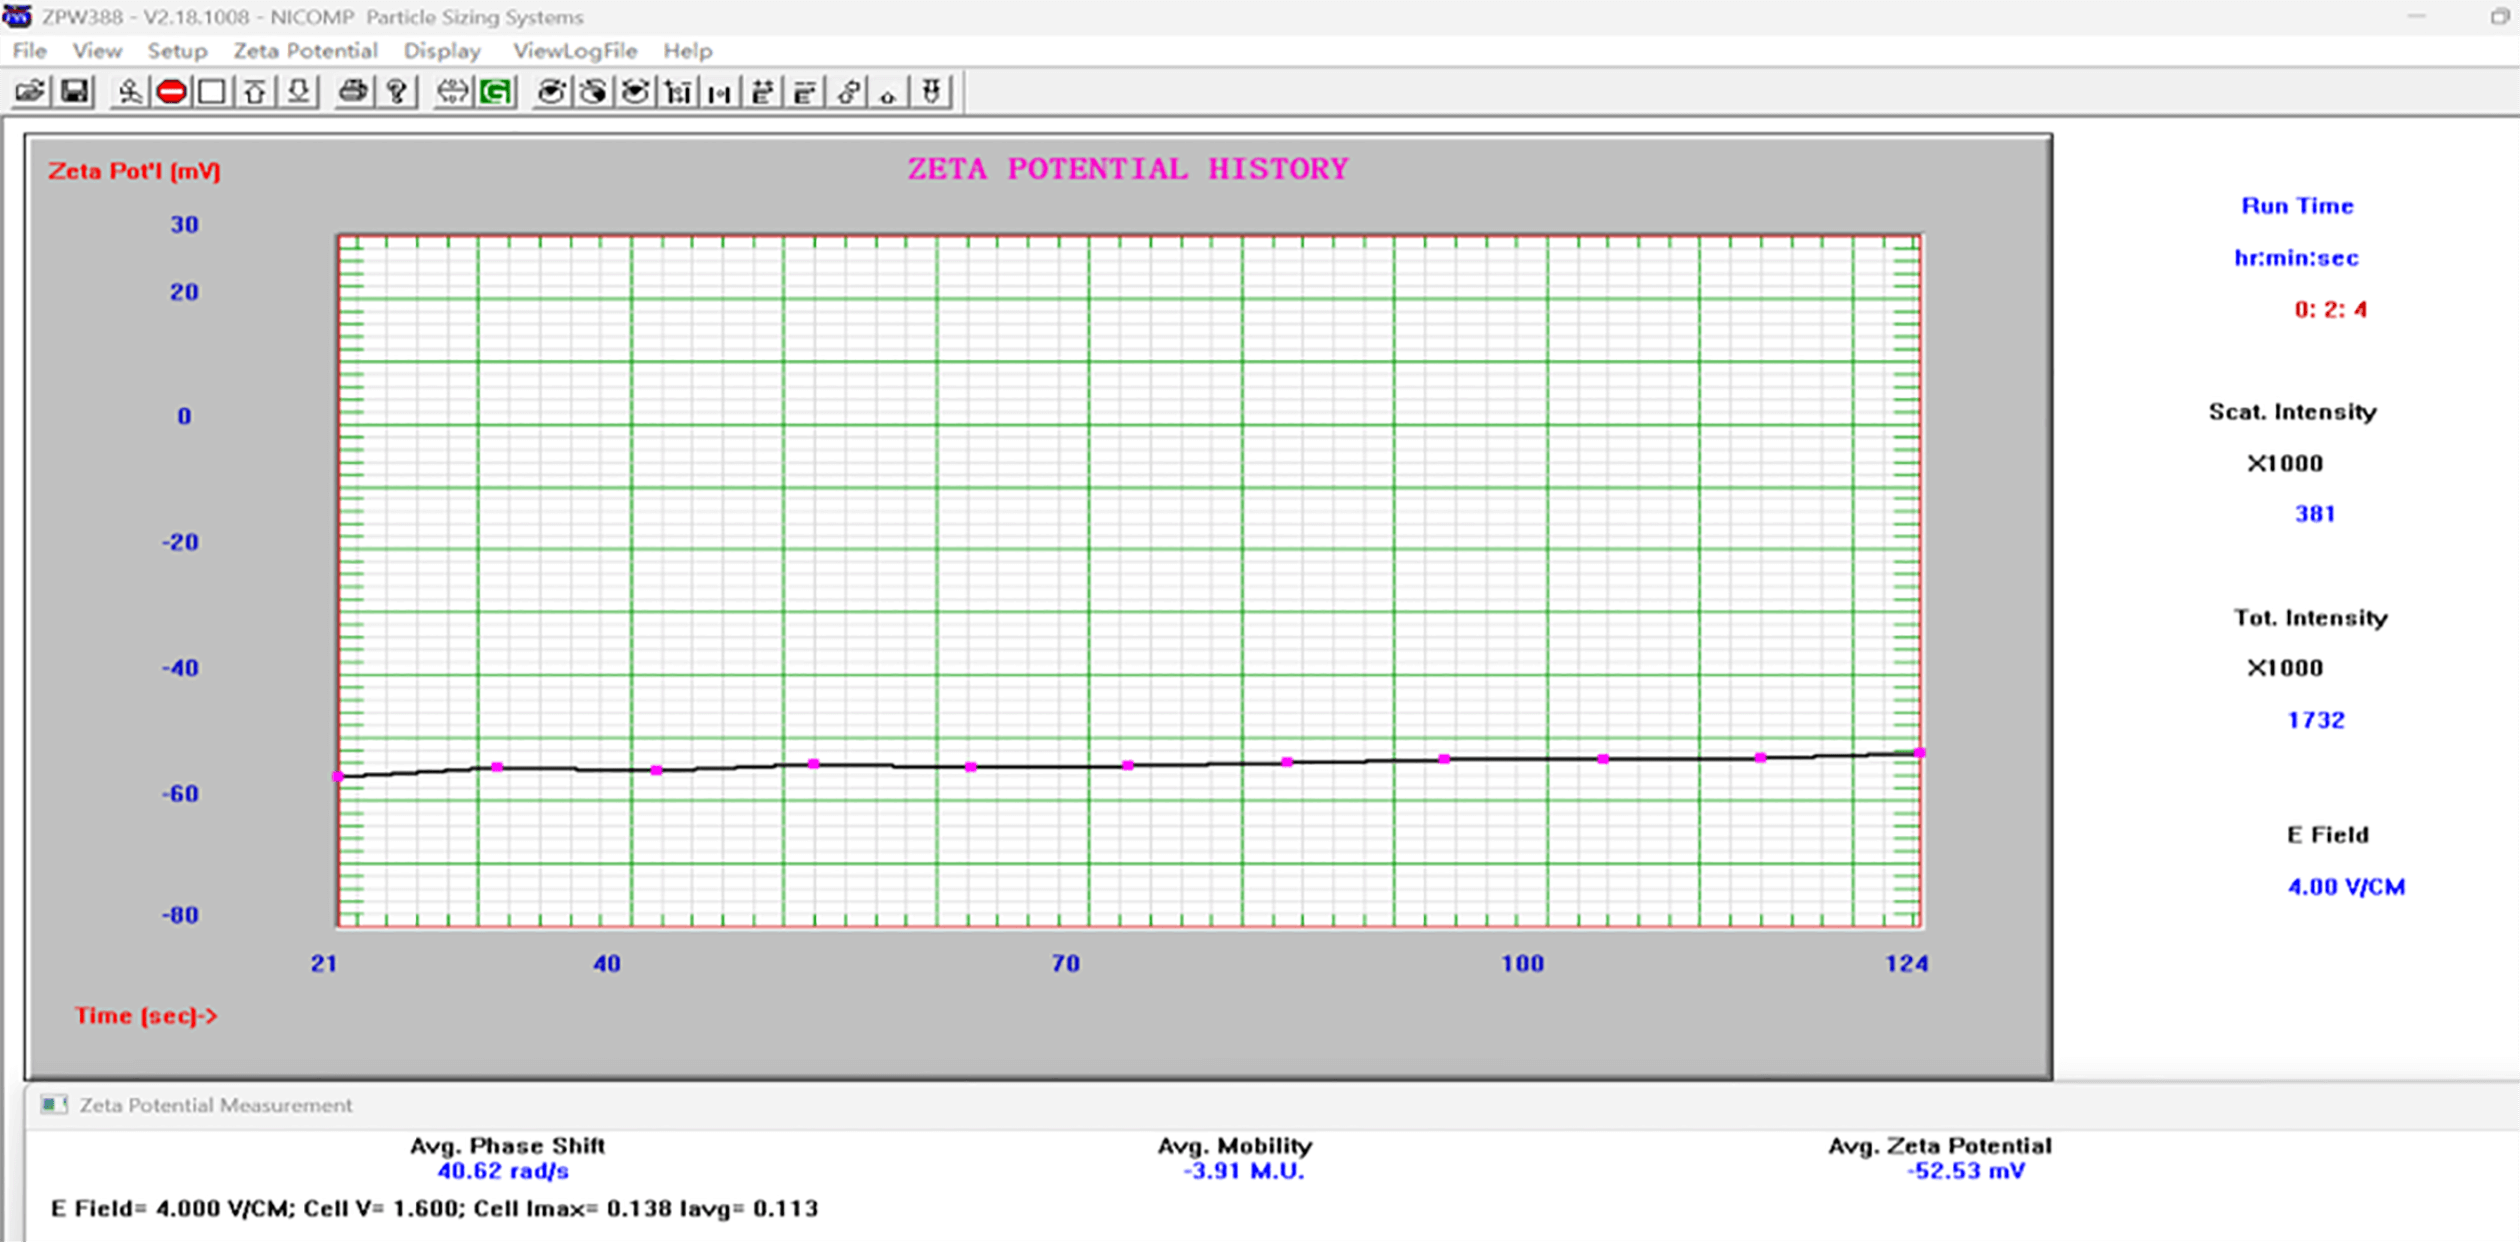
Zeta Potential Measurement Mode
Figure 1: Relationship between the incident laser beam and scattered light wave forELS; vector diagram relating these to the scattering wave vector K and particle velocity
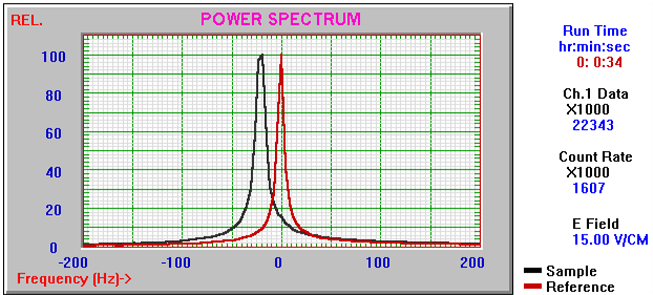
Power spectrum of a reference peak and a shifted sample peak.
Note: How sharp and narrow the peaks are. This is an indication of high quality optical components and a stable instrument.
Zeta Potential measuring interface : Frequency Power Spectrum
Zeta Potential Measurement Mode - Phase Mode
Measures small phase shifts for higher zeta sensitivity
Effective in high ionic strength or organic solvents
Zeta potential affects
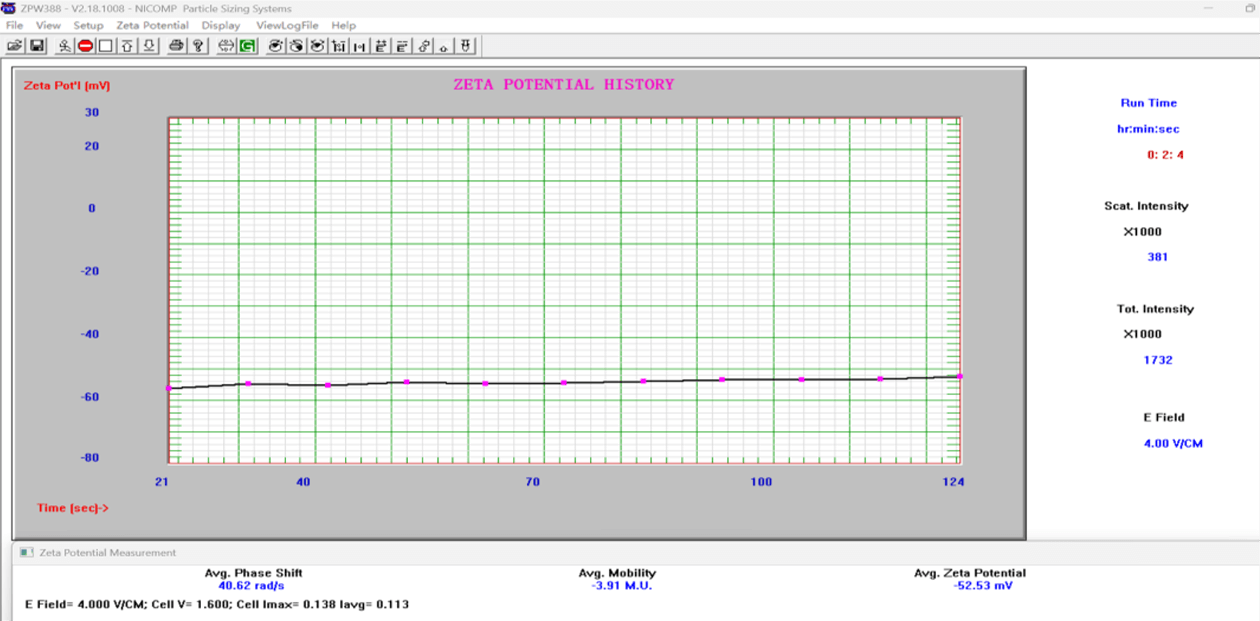
Zeta Potential measuring interface: Phase Analysis
Zeta value calculated by analyzing the phase difference between scattered light and reference light.
PRODUCT HIGHLIGHT
Nicomp - Three Nano Tools in one
UNIQUE FEATURES
Overview of NNLS (Non-Negative Least Squares):
- NNLS is a particle size distribution method that fits the autocorrelation function using non-negative least squares.
- Accurately represents single-peak or narrow-distribution samples.
Regularized non-negative least squares (NNLS)
The non-negative least squares (NNLS)algorithm fits the exponential decay of the correlation function algebraically. There are a variety of parameters that can be altered in an NNLS algorithm, but the two principal ones are the "weighting scheme" and the "alpha parameter" or "regularizer." Data weighting is used in DLS algorithms to amplify subtle changes in the larger and more significant correlation coefficients over noise in the baseline. In the absence of data weighting, noise in the baseline can lead to the appearance of artefact peaks and erroneous data interpretation.
The regularizer or alpha parameter in NNLS-based dynamic light scattering algorithms controls the acceptable degree of "spikiness" in the resultant distribution. Deconvolution of the DLS-measured correlation function is accomplished using an inverse Laplace transform that is ultimately reduced to a linear combination of eigenfunctions. The caveat to this approach is that when the eigenvalues are small, a very small amount of noise can make the number of possible solutions extremely large, hence the labelling of the DLS method as an ill-posed problem. In order to overcome the problem, a stabilizing term, in the form of the "first derivative" of the distribution solution, is added to the set of eigenfunctions.
9.2.2.4 Other algorithms
There are a number of other algorithms and programs which include L-Curve regularized positive exponential sum and others under various names, which are also based on NNLS analysis. In general, the difference between these algorithms is the optimization of variables (e.g. the "regularizer" or alpha parameter and the weighting scheme implemented) within the NNLS analysis in order to optimize it for a given set of instrument and sample conditions.
Reference:BS ISO 22412:2017 Particle size analysis - Dynamic lightscattering (DLS)
NICOMP Distribution – Advanced Version of NNLS
NICOMP = High precision + Multimodal analysis + More reliable particle size data
Nicomp vs Gaussian
Both Nicomp and Gaussian distributions originate from the same raw data, representing different ways of expressing the same dataset.
NICOMP better reflects the true distribution of the sample.
Multi-modal Nicomp algorithm
Options & Accessories
Upgrade: High-power Laser Diodes
Multi-angle Goniometer
90° offers the highest accuracy
Avalanche Photo Diode (APD) Detectors
Low-volume Cells
Autosampler
Autodilution
High Voltage Zeta Cells

Phase Analysis of Light Scattering (PALS)
APPLICATION
The dynamic light scattering capabilities of the NicompN3000 ensure precise sizing for nanometer sized particles, making it ideal for applications such as:


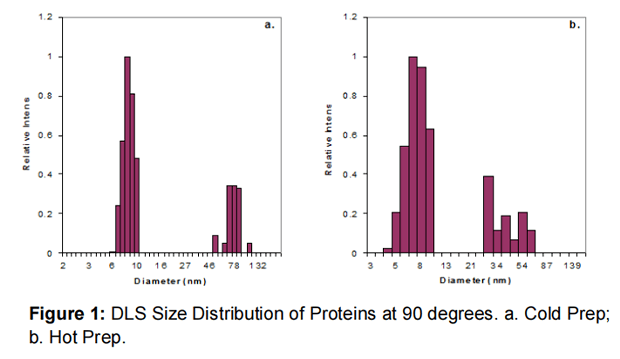
Nicomp® Multi-Angle Detection Module (MADLS)
BSA proteins were prepared by two methods and measured at different scattering angles using the Nicomp.
When measured at 90°, both samples (1a for Cold Prep and 1b for Hot Prep) displayed a dominant peak near 8 nm, consistent with the expected size of monomeric BSA. A secondary, less distinct peak around 50 nm was also detected in both samples, indicating the presence of minor protein aggregation and larger particles.
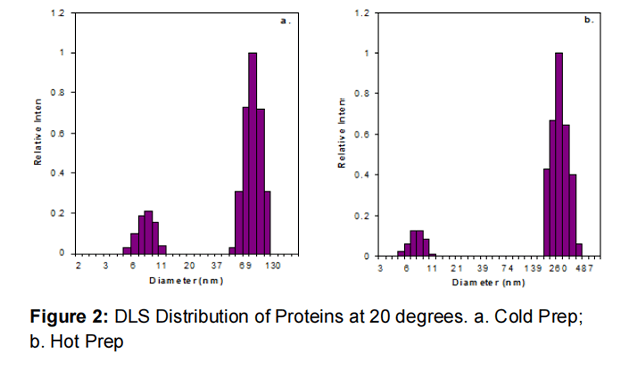
At 20°, while the 8 nm peak persisted in both samples (2a and 2b), Cold Prep (2a) exhibited a distinct peak at 80 nm, and Hot Prep (2b) showed a sharp peak at 265 nm. Comparing results across angles, the 8 nm peak confirmed the accuracy of the primary protein size distribution, while the enhanced resolution at 20° revealed clearer differentiation of larger aggregates. This highlights how lower-angle detection improves sensitivity for small-particle systems like proteins, enabling more precise identification of subtle aggregation and sample-specific variations through multi-angle analysis.
Reference:PSS AN 158 Protein Aggregation with DLS-MA.
Ultra-High Resolution of the Nicomp® 3000
Through standard particle measurements, the Nicomp® series demonstrates exceptional sensitivity and accuracy even for particles smaller than 10 nm. This ultra-high resolution allows researchers to precisely characterize mixtures and quantify their components. The following experiment analyzed protein samples.
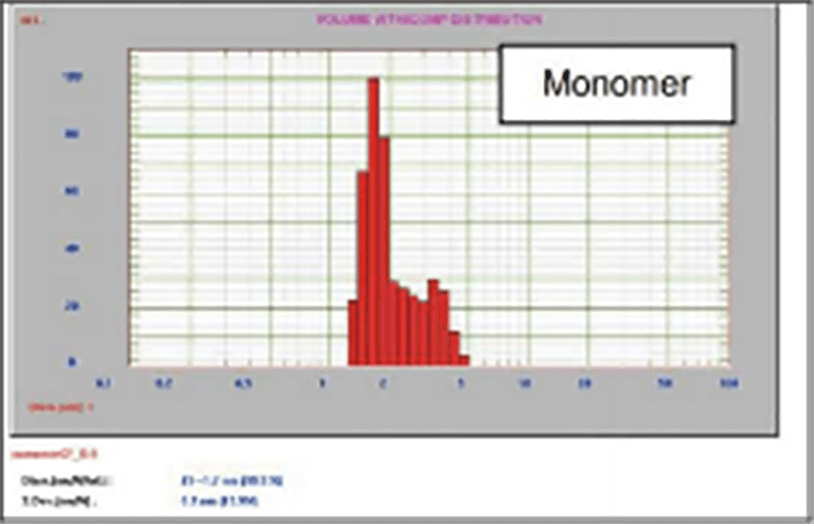
The measured particle size of the protein monomer was 1.7 nm.
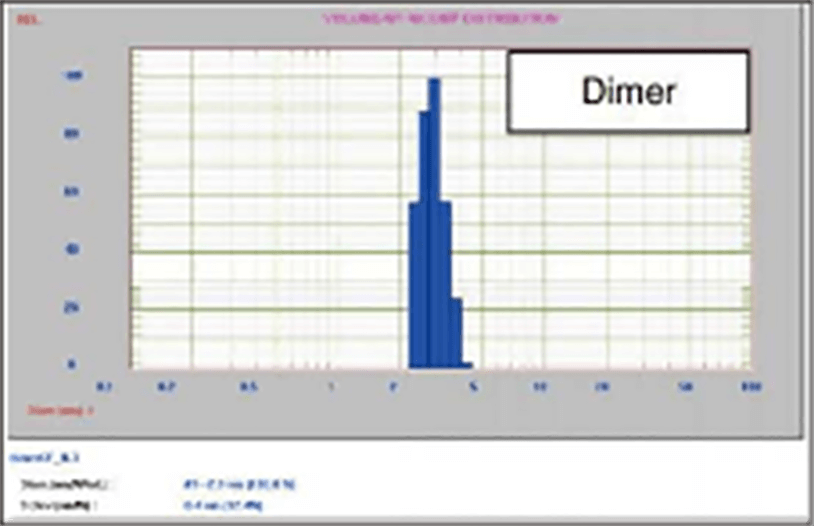
The theoretical size of the protein dimer is approximately twice that of the monomer (3.4 nm). The Nicomp® 3000 measured a size of about 2.9 nm, which closely matches the theoretical value.
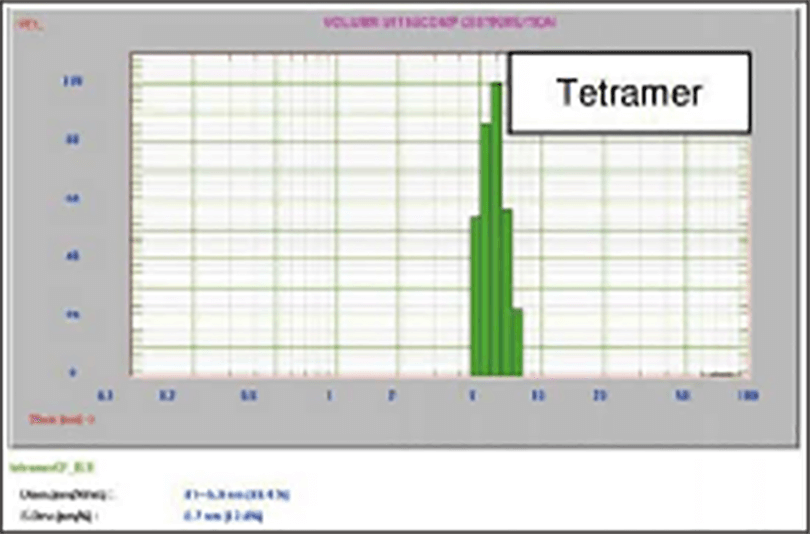
The theoretical size of the tetramer is four times that of the monomer (6.8 nm). The Nicomp® 3000 measured a value of around 5.7 nm, consistent with the expected size.
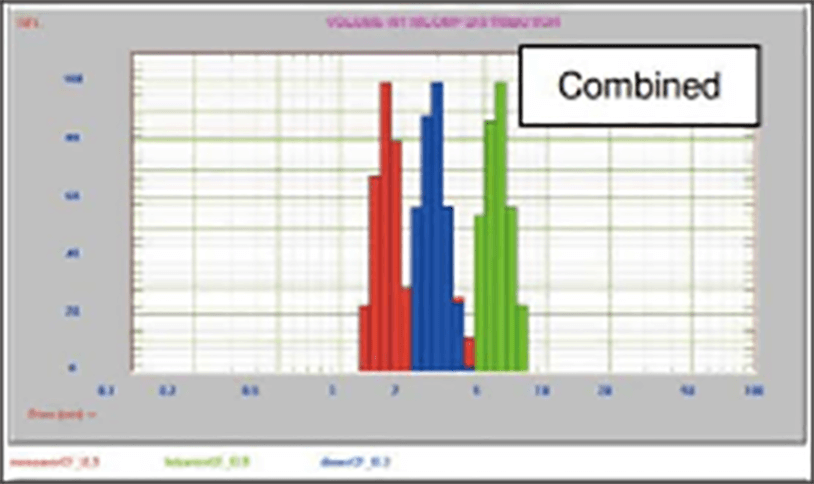
When the three datasets are overlaid, three distinct peaks under 10 nm can be clearly resolved.
This demonstrates the ultra-high resolution and sensitivity of the Nicomp® 3000 series for detecting subtle size differences in nanoscale proteins.
Reference: PSS_AN_Ent_datasheet-why-buy-nicomp-dls-system-10957.
Battery: Graphene
 Sample1
 Sample2
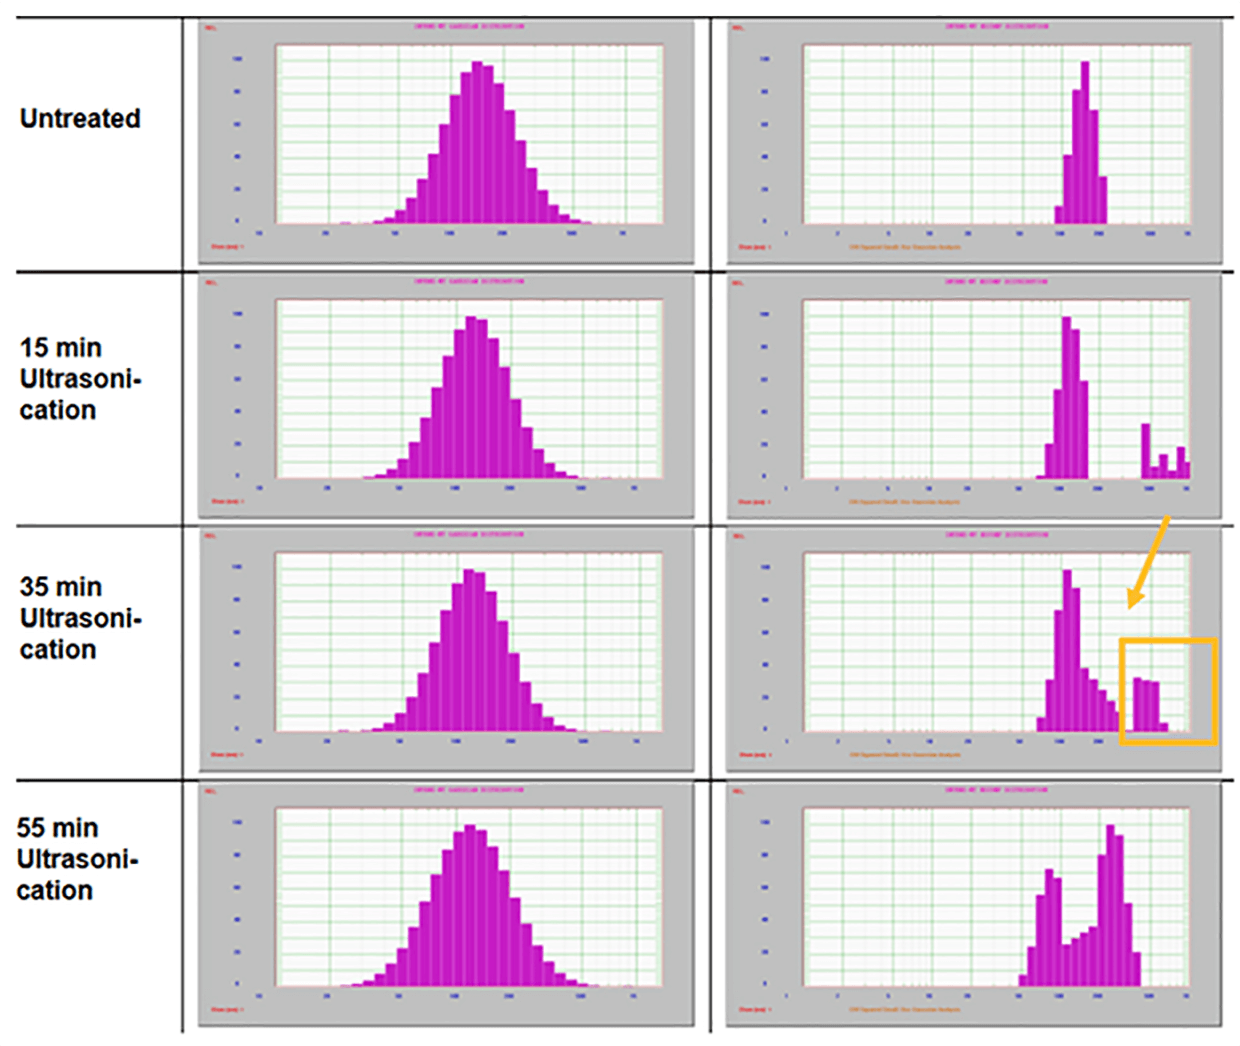
- Two graphene samples with similar mean particle sizes measured by Nicomp.
- Gaussian distribution shows little difference in average size.
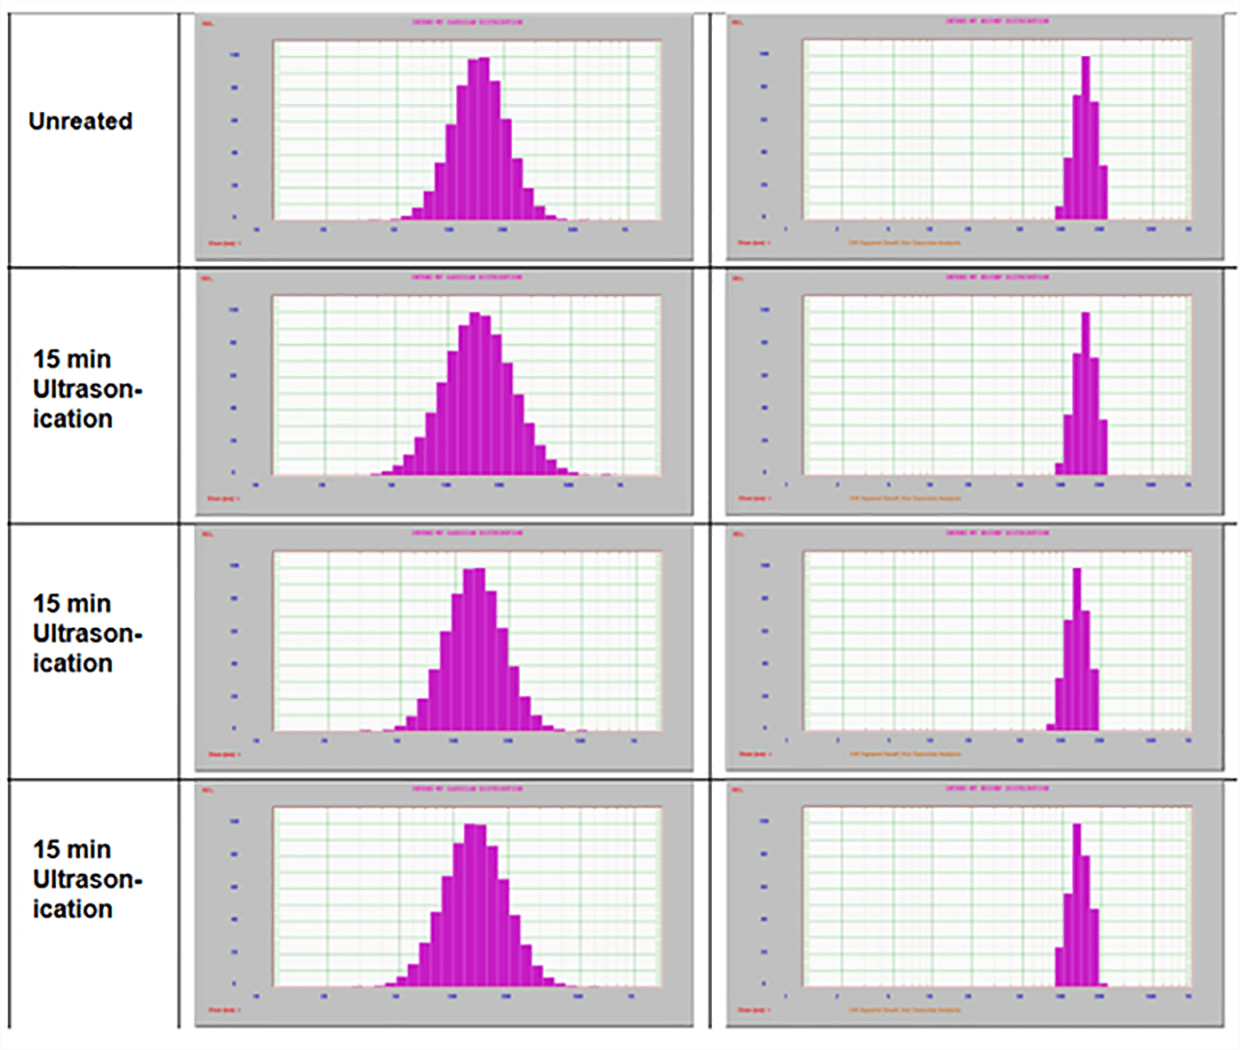
- Ultrasound applied: 15min, 35min, 55min.
- Sample 1 shows aggregation at the tail, gradually dispersing with longer sonication.
- Sample 2 remains stable, no multi-peak appears; peak shifts left as size decreases.
Emulsion: Formulation screening
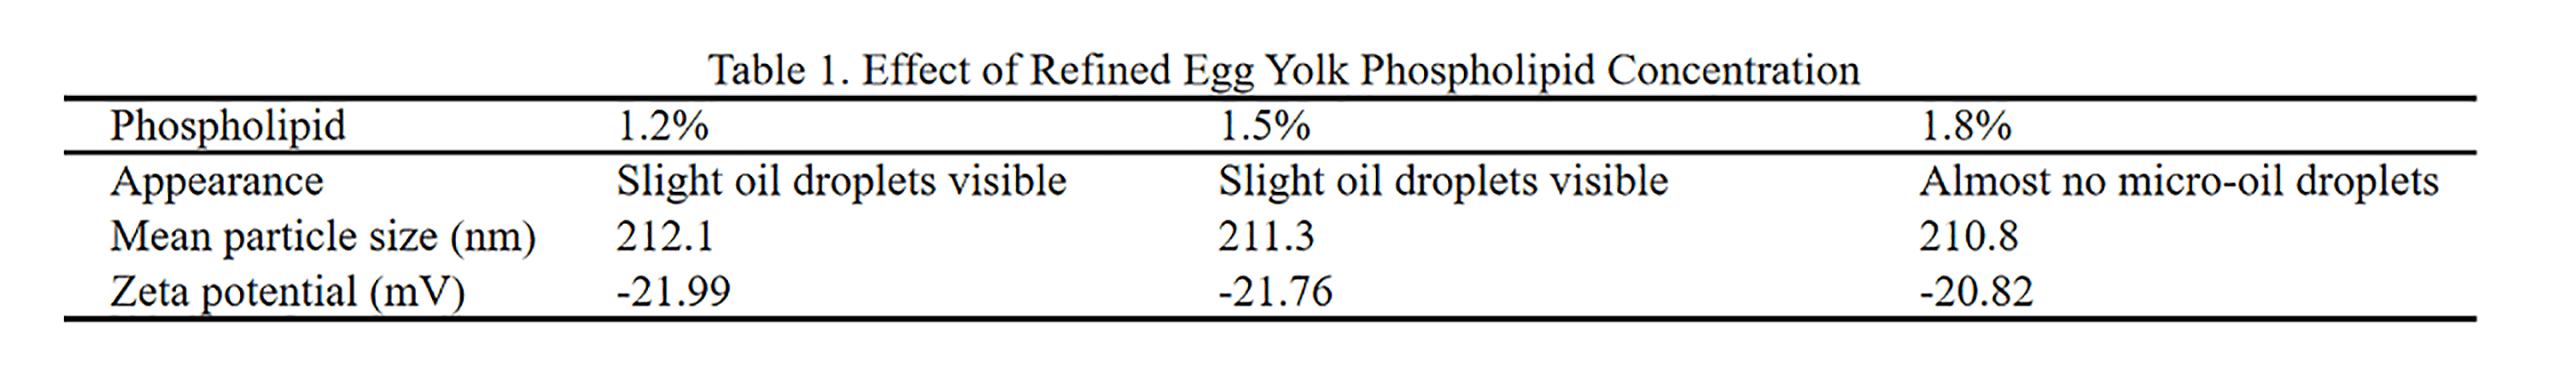
Propofol emulsions were prepared using refined egg yolk phospholipid as the emulsifier. The goal was to optimize the formulation by evaluating how phospholipid and oleic acid concentrations affect emulsion stability.
The Nicomp Dynamic Light Scattering (DLS) system was used to measure particle size and zeta potential, providing key indicators for formulation optimization.
Phospholipid concentration (1.2% → 1.8%) was adjusted, and the Nicomp measured smaller mean particle sizes and more uniform distributions with increasing phospholipid levels.
Oleic acid addition (0.05–0.10%) was found—through Nicomp zeta potential analysis—to enhance electrostatic stability and reduce post-sterilization oil separation
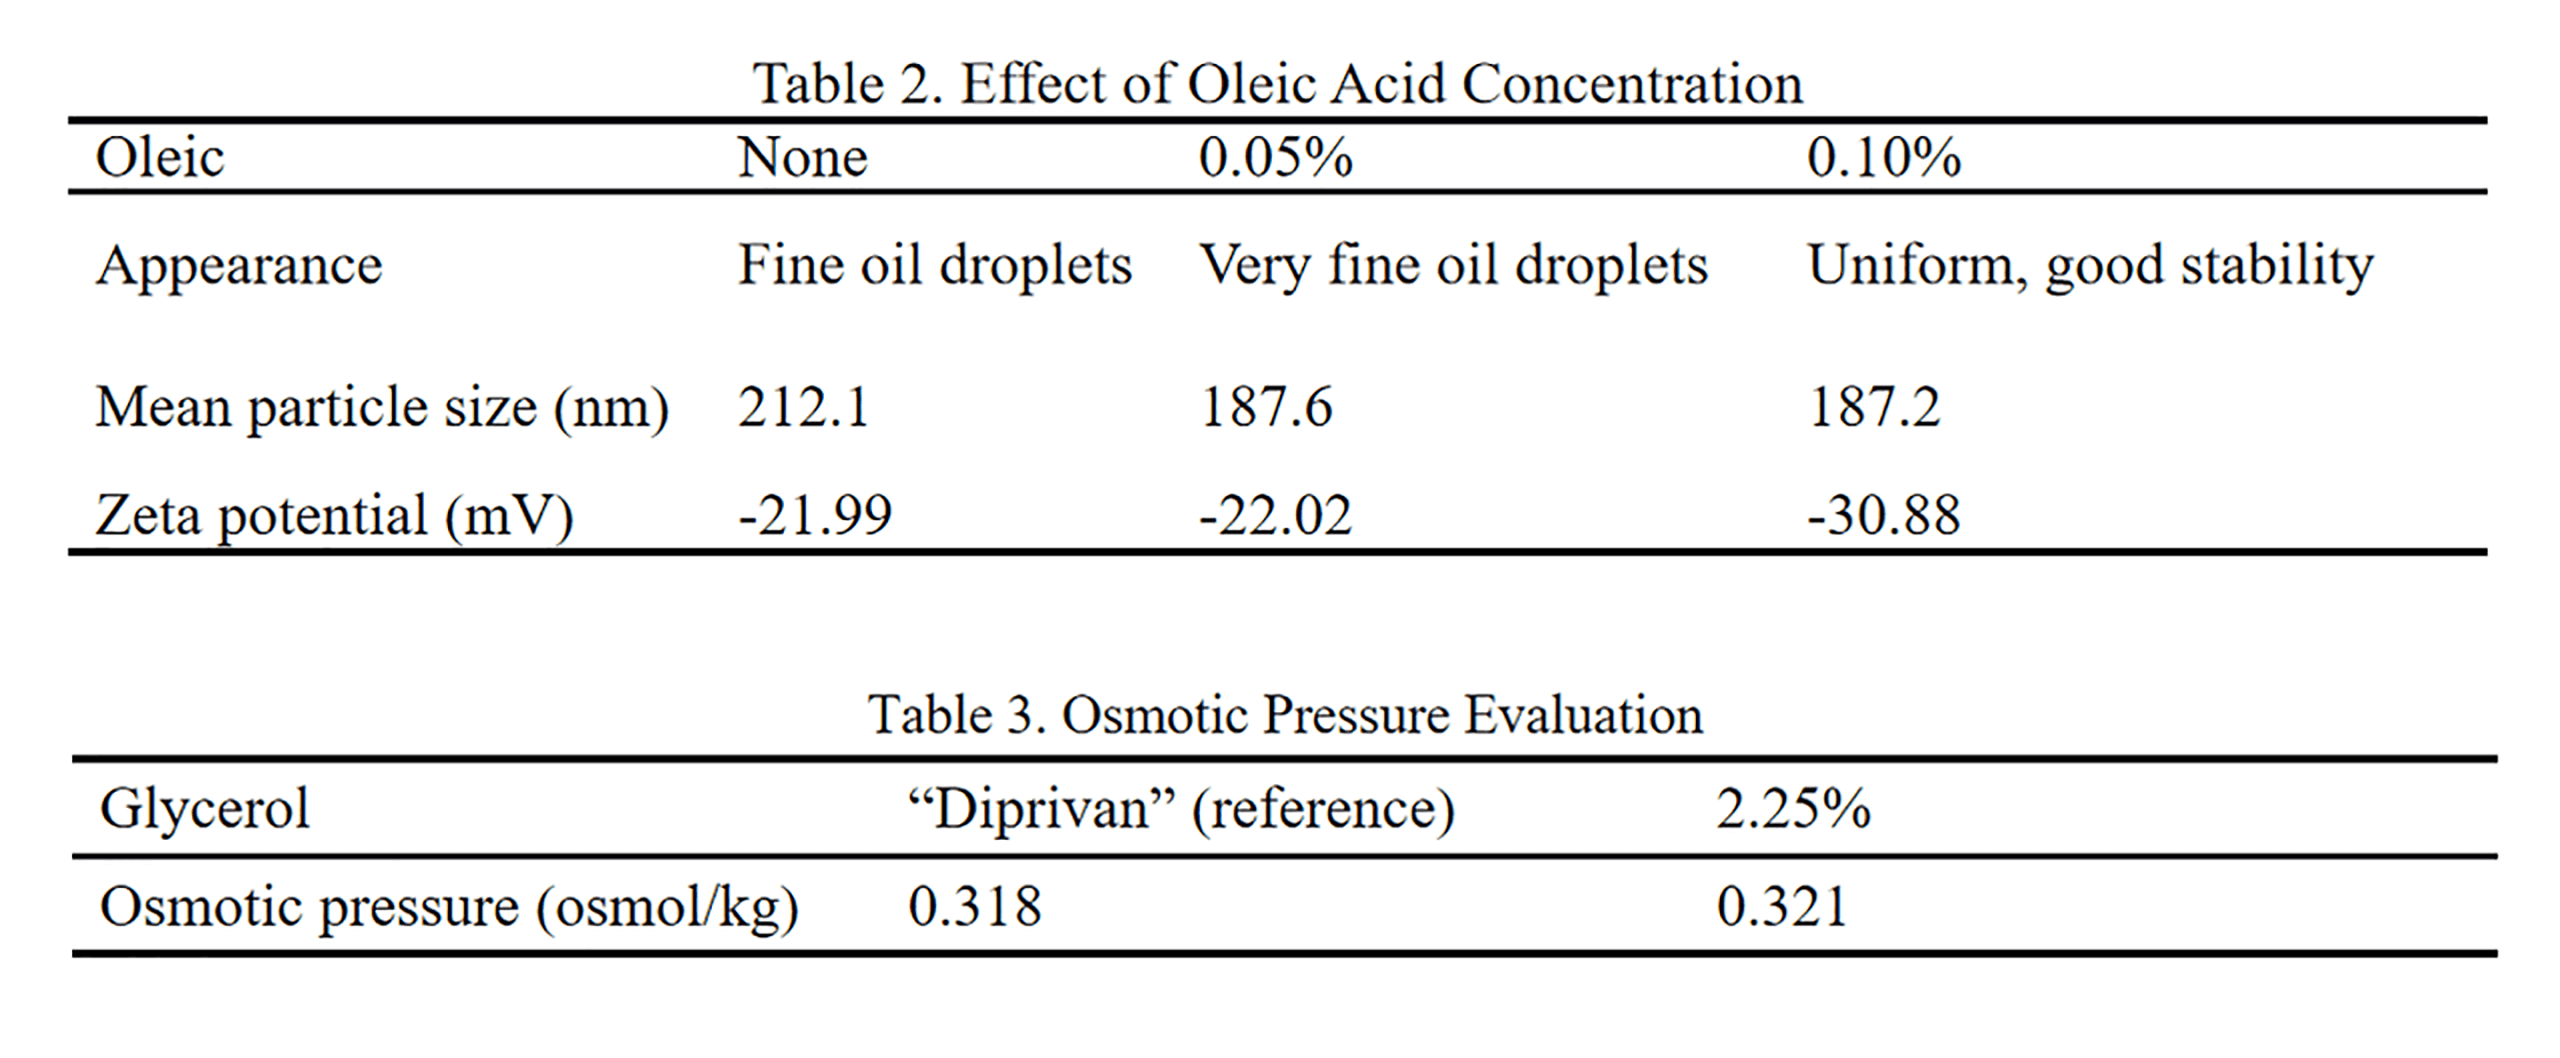
Using the Nicomp system enabled accurate monitoring of emulsion particle size and zeta potential, helping identify the optimal formulation with 1.8% phospholipid and 0.10% oleic acid.
This composition showed uniform particle size, good stability, and physicochemical performance comparable to the reference product "Diprivan."
Emulsion: Fat emulsion stability
The Nicomp DLS system was used to analyze fat emulsions with different stability levels.
The blue curve represents the unstable emulsion, while the purple curve represents the stable emulsion.
Left (Gaussian Distribution):
Both emulsions show similar mean particle sizes. The Gaussian model assumes a single peak, which makes it difficult to distinguish stability differences.
Right (Nicomp Multi-modal Distribution):
The unstable emulsion (blue) shows a clear secondary peak (~600 nm), indicating the presence of larger oil droplets.
The stable emulsion (purple) displays a single, narrow peak (~280 nm), reflecting good uniformity and stability.
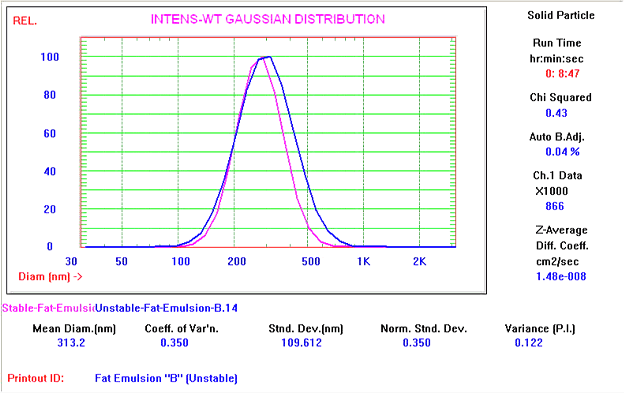
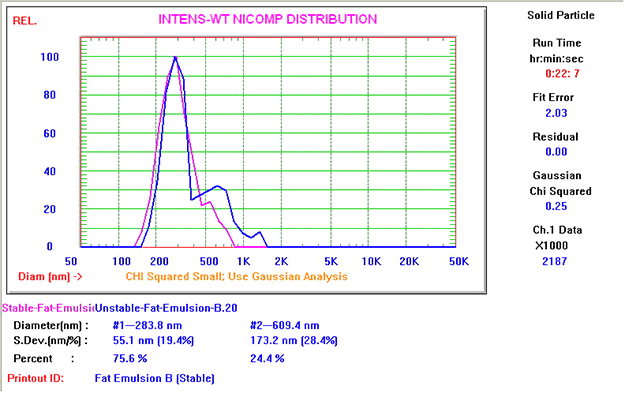
The multi-modal Nicomp analysis reveals hidden large-particle populations that the Gaussian model cannot detect.
This explains why pharmacopoeial methods emphasize the detection of large droplets, which are critical for emulsion stability and safety.
SPECIFICATION
| Configuration | Standard | Pro | Plus | Ultimate |
|---|---|---|---|---|
| Temperature | 0℃~90℃ (+0.1'C temperature accuracy, no condensation) | |||
| Laser Light Source | Solid State Laser | |||
| Laser Power | 15mw | 35mw | 35mw | 35mw |
| Ph Value Range | 1~14 | |||
| Particle Size | Standard | Pro | Plus | Ultimate |
|---|---|---|---|---|
| Analysis Method | Dynamic light scattering, Gaussian distribution and Nicomp multi-peak distribution | |||
| Detection Range | 0.3nm~10µm | |||
| Minimum Sample Volume | 10µL (Particle size) | |||
| Maximum Concentration | 40% w/v | |||
| Measurement Angle | 90° | 90° | 90° | Multi-angle (14.4°-180° including 90°, with a step of 0.9°) |
| Molecular Weight | 342-2×10⁷Da | |||
| ZETA Potential | Standard | Pro | Plus | Ultimate |
|---|---|---|---|---|
| Detector | Electrophoretic Light Scattering (ELS), Multi-frequency Correlogram Analysis / Phase Analysis Method | |||
| Detection Range | 0.3nm~100µm | |||
| Zeta Potential Range | ±500mV | |||
| Maximum Concentration | 40% w/v | |||
| Detection Angle | ~14.9° | |||
| Accessories | Standard | Pro | Plus | Ultimate |
|---|---|---|---|---|
| Detector | PMT (Photomultiplier Tube) | PMT (Photomultiplier Tube) & APD (Avalanche Photodiode) | ||
| Sample Cell | ■ | ■ | ■ | ■ |
| Research Edition Software | ■ | ■ | ■ | ■ |
| 21 CFR Part 11 Software | □ | □ | □ | □ |
| Multi-angle Detection Module | / | / | ■ | ■ |
| Automatic Sampling Module | / | / | / | ■ |
| Automatic Dilution Module | / | / | ■ | ■ |
| Dimensions | 56cm × 41cm × 24cm | |||
| Weight | Approximately 26kg (varies with configuration) | |||